


Auction Risk Score
One number, 0–100, trained on 43M auction outcomes. Aggregates auction frequency, damage severity, secondary damage, airbag status, run-and-drive, and repair cost into a single bid-or-walk call.
For Dealers
Auction Risk Score, market price, photo forensics, and the full auction-to-retail trail — in one report your buyer can't argue with.
What it answers
Most VIN reports stop at "Clean" vs "Salvage." Ours grouped 17 separate analyses into four answers a dealer actually buys on.
Auction Risk Score, VIN Signals, Photo Forensics, Specs & Safety Decode.
2Market Price Range, Trade-in tiers, Same-VIN Price Erosion, Trim Premium, Window Sticker, CPO Eligibility.
3Auction & Listing Trail, Sales History, VIN Footprint Map, Specifications.
4Market Velocity, Supply & Demand, Auction-Retail Spread, Market Pulse, Similar Vehicles, Wallet.
Inside one report
A real sample report on a 2023 Audi RS 5. Scroll the right side — the active section on the left moves with you.

One number, 0–100, trained on 43M auction outcomes. Aggregates auction frequency, damage severity, secondary damage, airbag status, run-and-drive, and repair cost into a single bid-or-walk call.
Curbstoner patterns, repo trail, cross-state title-bouncing, multi-seller identity laundering. The flags that don't fit into a single damage field.
Same-VIN photo comparison across every listing. Detects crop patterns that hide damage, mismatched odometer readings, and time-of-photo concealment.
NHTSA + IIHS safety ratings, active recalls, factory options decoded from the VIN. Includes recall completion status.
Live cohort min/max/average across every active listing — same year, make, model, trim, mileage band.
Fair / Good / Excellent trade values, derived from the cohort and condition mix. Use it at the desk before you name a number.
Every time this exact VIN was re-listed, what it dropped. Eight re-lists at -6% each tells you something a one-shot KBB lookup won't.
What a Limited earns over an LE, what Antimatter Blue costs over white. Cohort-derived, not estimated.
Original OEM Monroney sticker — options, MSRP, build location. Pulled from the factory record, not a re-build.
Whether this VIN qualifies for the OEM certified-pre-owned program — age, mileage, brand history.
Chronological timeline — every auction event, every listing, every relist, every retail sale. Every event has a source, a date, and a price (if priced).
Final sale records — retail dealer, auction sale, lease-end, fleet disposition. Sourced from DMV, auction-house feeds, and listing reconciliation.
Every listing pinned to the city where it was for sale. Bouncing across three states in 18 months is a story; this map tells it.
Days-to-sell for this exact cohort vs the market average. "47 days vs 62 avg" tells you it's the slow lane or the fast lane.
Active listings vs sold-per-week. Over-supplied? Hold price. Under-supplied? Mark up before someone else does.
Median margin per unit if you bought from auction and sold retail. The buy-side number that goes on the back of an envelope.
Cohort 90-day price trend. Going up, sideways, or down — and by how much.
Comparable inventory active in your region. Use it to position price before a listing goes live.
Running cost-of-ownership math — projected fuel, depreciation curve, residual after one and three years.
See it in motion? Open the full Audi RS 5 sample report →
The Score
The Auction Risk Score is what your dealer plan pays for. Here's what's inside.
Example: 2019 sedan, three auction passes, frame damage, airbag deployment.
Updated nightly. Weights adjust per cohort.
Market Intelligence
Numbers from a real report on a 2024 Toyota RAV4. Every report runs all six, computed live for the VIN.
6 re-lists · –8% / mo
LE base · XLE +$1.4k · Ltd +$3.2k
vs 62 cohort avg
412 active · 89 sold/wk
per unit, cohort median
↗ +6% over 90 days
Photo Forensics & VIN Signals
Same 2023 Audi RS 5. Dealership listing on the left, auction record on the right. Drag the handle to see what the seller didn't.
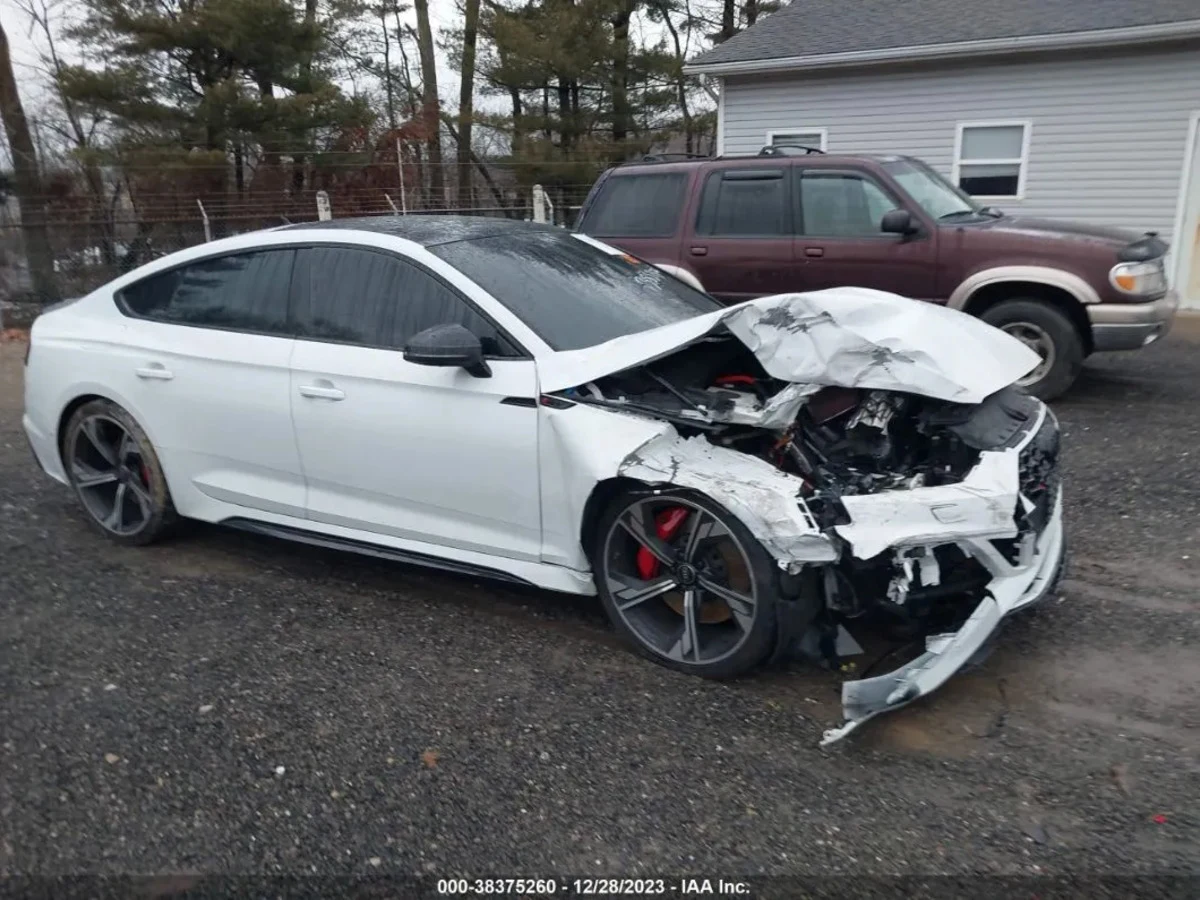
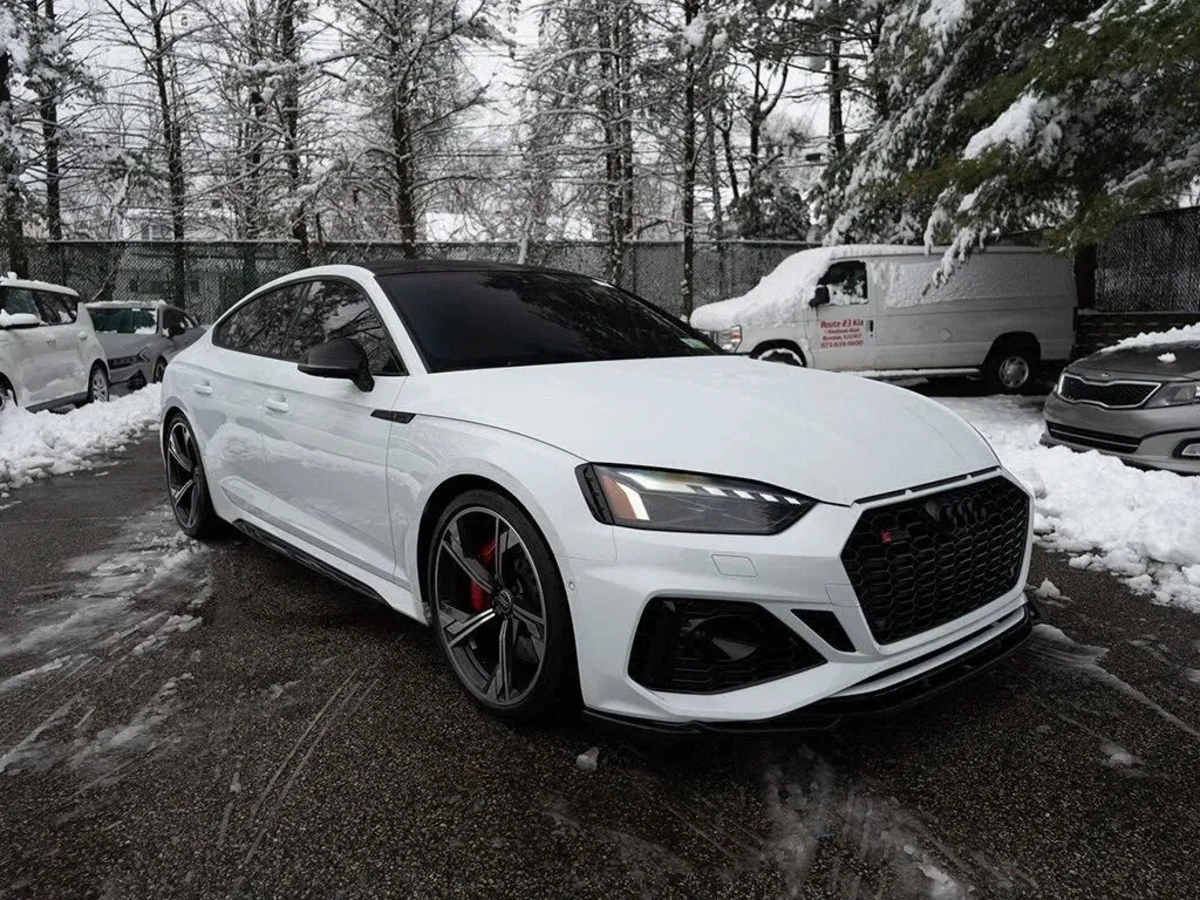
Same VIN — WUAAWCF54PA900334. Photo Forensics flagged the gap between the retail listing and the IAA auction record.
2 / 5 (slow — auction history depresses retail demand)
This is one report. Every report runs Photo Forensics and VIN Signals against every photo and every listing.
See it in action
Three real VINs, three different stories — same 17 surfaces, different headlines.
$48k–$80k
avg $64,568
1 event
2023-12-29
none
Premium coupe with thin comps — Trim Premium and Cross-Brand Comparison do the work.
See the full Audi RS 5 sample report →$13k–$338k
avg $31,660
1 event
2025-09-21
none
Mainstream best-seller — Supply/Demand and Price Erosion show whether to hold or cut.
See the full Toyota RAV4 sample report →$25k–$82k
avg $55,434
7 events
2025-12-02
EV repo trail — Auction-Retail Spread and VIN Footprint Map tell the full story.
See the full BMW i4 sample report →How it ships
Pull a report from inventory or search any VIN. All plans.
One-click on Cars.com, AutoTrader, CarGurus, Manheim, +8 more.
Your name, your logo, no VinAssessment branding. Pro & Enterprise.
Same VIN data over REST. Hit from your DMS or ATS. All plans.
FAQ
Four straight answers. The rest get covered in a 20-minute demo call.
Both. Any VIN with a history in our database is covered — new vehicles with auction exposure, off-lease returns, certified pre-owned, fleet, and used. If a new vehicle crossed an auction block before it landed on a lot, the report shows it.
Auction photos come directly from auction house records — condition photos taken when a vehicle is inspected before it runs through a sale. Major national auction networks and regional independents. What you see is what the auction floor saw.
Auction and title records refresh as feeds arrive — typically within 24–48 hours of filing. Listings update daily across every major platform we scan. If a vehicle was listed yesterday, today's report reflects it.
Yes. The dealer plan includes unlimited reports — no per-report fees, no monthly cap. Independent lots and 12-rooftop groups both run on the same unlimited tier. See Pricing for details.
Get a 20-minute demo. We'll run a real VIN from your pre-auction list and walk through the Auction Risk Score, VIN Signals, and full auction-to-retail trail — live.