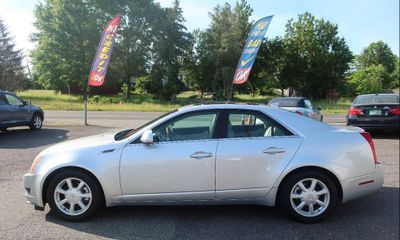
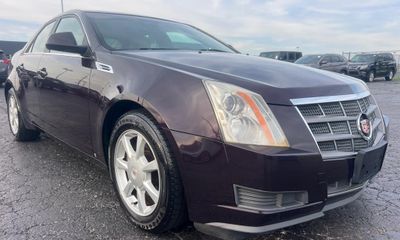
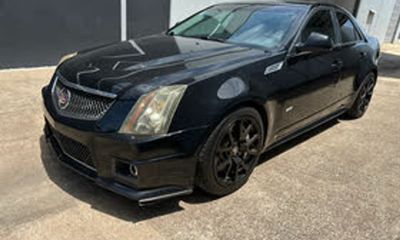
2009 Cadillac CTS Premium
WAULF98K79N058318
This vehicle is no longer listed. The figures below describe the market for this build.
Last listed by Commerce Chevrolet
This VIN is no longer listed by this dealer. They may still have a similar vehicle — ask.
Contact details come from the dealer's listing and public business records. VinAssessment is not the seller and takes no fee — you deal with the dealer directly.
Listings
Full listing history on VehiSales →No active listings of this exact VIN right now.
Decoded from the VIN
NHTSA build data for WAULF98K79N058318- ✗ Backup camera
- ✗ Blind-spot monitor
- ✗ Lane departure
- ✗ ABS
- ✗ Electronic stability
Fuel economy (EPA)
Assumes 15,000 miles a year at $3.10/gallon and 20 MPG combined.
Safety & recalls
NHTSA crash tests & recall campaigns for this model yearThe 2009 Cadillac CTS has 5 recall campaigns as of August 2026. NHTSA rated it 4 out of 5 stars for rollover. EPA combined fuel economy: 20 MPG.
Tested configuration: 2009 Cadillac CTS 4-DR. w/SAB Later Release
-
ELECTRICAL SYSTEMThis defect can affect the safe operation of the airbag system.NHTSA campaign 14V394000
-
SUSPENSIONGENERAL MOTORS IS RECALLING CERTAIN MODEL YEAR 2009-2010 CADILLAC CTS VEHICLES.NHTSA campaign 11V089000
-
AIR BAGSGM IS RECALLING 12,662 MY 2009 CADILLAC CTS VEHICLES FOR FAILING TO CONFORM TO THE REQUIREMENTS OF FEDERAL MOTOR VEHICLE SAFETY STANDARD NO.NHTSA campaign 08V582000
Recall campaigns apply to the model year, not to one car. Check remedy status for this VIN at nhtsa.gov/recalls.
Model-level data for the 2009 Cadillac CTS from NHTSA (recalls, NCAP crash tests) and EPA fueleconomy.gov, refreshed August 28, 2026.
Where the price is heading
Typical asking price for a Cadillac CTS over the last 6 months — the market firmed $367 in that span.
Monthly price table
| Month | Typical price |
|---|---|
| April 2026 | $7,628 |
| May 2026 | $7,495 |
| June 2026 | $7,749 |
| July 2026 | $7,995 |
| August 2026 | $8,992 |
| September 2026 | $7,995 |
Market by model year
What each model year costs right now — live supply, median asking price and how much value each year keeps versus the newest one.
| Year | Units for sale | Median price | vs newest | Avg mileage |
|---|---|---|---|---|
| 2019 | 142 | $18,857 | 100% | 72,788 mi |
| 2018 | 60 | $17,102 | 91% | 82,001 mi |
| 2017 | 89 | $15,995 | 85% | 81,521 mi |
| 2016 | 171 | $13,995 | 74% | 85,262 mi |
| 2015 | 103 | $12,598 | 67% | 100,575 mi |
| 2014 | 280 | $12,261 | 65% | 95,676 mi |
| 2013 | 196 | $10,229 | 54% | 102,110 mi |
| 2012 | 234 | $10,422 | 55% | 95,861 mi |
Units for sale — listings of each model year in the latest nightly market snapshot.