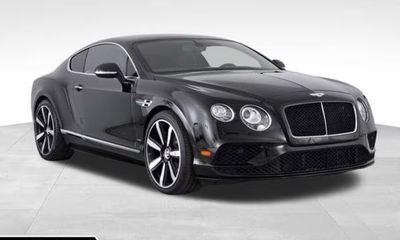
2017 Bentley Continental GT Supersports
SCBFB7ZA6HC065294
GOOD DEAL
· $22,792 below typical price
This 2017 Bentley Continental GT Supersports is listed at $129,995 with 41,350 miles.

Market price range
Based on 4 comparable same-build listings · Market data as of September 3, 2026This vehicle: $129,995 — $22,792 below the typical market price ($152,787)
Asking $129,995 · typical market price $152,787 · based on 4 comparable same-build listings.
See all 2017 Bentley Continental prices — typical $152,787 →
Price history for this VIN
Asking price over time
Asking prices recorded across 12 listing dates for VIN SCBFB7ZA6HC065294, spanning 4 years 4 months.
Active listings
Full listing history on VehiSales →| Dealer | Location | Price | Mileage | Listed |
|---|---|---|---|---|
| RP Exotics | 63132 | $129,995 | 41,350 mi | 2026-08-26 |
| RP Exotics | Saint Louis, MO 63132 | $130,599 | 41,350 mi | 2026-05-16 |
Former listings
| Dealer | Location | Price | Mileage | Listed |
|---|---|---|---|---|
| RP Exotics | Saint Louis, MO 63132 | $112,888 | 41,350 mi | 2026-08-26 |
| TxTCharlie | Fort Lauderdale, FL 33316 | $99,999 | 40,805 mi | 2025-12-24 |
| Exotic Car Trader Southeast | Tallahassee, FL 32303 | $134,999 | 36,000 mi | 2023-03-10 |
| Da Vinci Automotive | Jacksonville, FL 32207 | $169,895 | 34,302 mi | 2022-04-28 |
What would this 2017 Bentley Continental GT Supersports cost per month?
Estimate the monthly payment on a $129,995 vehicle. Move the numbers to match your own loan.
Estimate only. Excludes tax, title, registration and dealer fees, and assumes a fixed-rate loan with equal monthly payments. Your actual rate depends on your credit and lender.
Decoded from the VIN
NHTSA build data for SCBFB7ZA6HC065294Full factory specs for this build →
- ✓ Backup camera
- ✗ Blind-spot monitor
- ✗ Lane departure
- ✓ ABS
- ✓ Electronic stability
Fuel economy (EPA)
Assumes 15,000 miles a year at $3.10/gallon and 18 MPG combined.
5-year cost to own
Beyond the sticker: what this 2017 Bentley Continental likely costs over five years at 15,000 mi/yr.
Estimate — insurance and taxes vary by driver and state.
Safety & recalls
NHTSA crash tests & recall campaigns for this model yearThe 2017 Bentley Continental has 1 recall campaign as of August 2026. EPA combined fuel economy: 18 MPG.
-
STEERINGBentley Motors, Inc. (Bentley) is recalling certain 2017-2018 Continental Supersports vehicles.NHTSA campaign 19V863000
Recall campaigns apply to the model year, not to one car. Check remedy status for this VIN at nhtsa.gov/recalls.
Model-level data for the 2017 Bentley Continental from NHTSA (recalls, NCAP crash tests) and EPA fueleconomy.gov, refreshed August 28, 2026.
Where the price is heading
Typical asking price for a 2017 Bentley Continental over the last 6 months — the market firmed $643 in that span.
Monthly price table
| Month | Typical price |
|---|---|
| April 2026 | $95,247 |
| May 2026 | $92,600 |
| June 2026 | $94,046 |
| July 2026 | $89,938 |
| August 2026 | $89,989 |
| September 2026 | $95,890 |
How it compares to rivals
Median asking price for comparable body styles listed near this car| Model | Median price | For sale nearby | vs this car |
|---|---|---|---|
| 2017 Bentley Continental GT Supersports (this car) | $129,995 | 4 | — |
| 2017 Ford Mustang | $18,120 | 9 | −$111,875 |
| 2015 Dodge Challenger | $19,797 | 7 | −$110,198 |
| 2018 Porsche 911 | $189,995 | 5 | +$60,000 |
| 2017 Lexus RC | $33,941 | 4 | −$96,054 |
| 2017 Chevrolet Camaro | $22,618 | 3 | −$107,377 |
Cheapest active listings of each comparable body style in this region — median of what those models actually ask.
Market by model year
Gen 2 · 2010–presentWhat each model year costs right now — live supply, median asking price and how much value each year keeps versus the newest one.
| Year | Units for sale | Median price | vs newest | Avg mileage |
|---|---|---|---|---|
| 2026 | 271 | $362,774 | 100% | — |
| 2025 | 52 | $320,246 | 88% | 2,597 mi |
| 2024 | 60 | $258,450 | 71% | 6,022 mi |
| 2023 | 71 | $224,899 | 62% | 9,710 mi |
| 2022 | 91 | $211,564 | 58% | 12,953 mi |
| 2021 | 32 | $177,698 | 49% | 17,330 mi |
| 2020 | 95 | $156,799 | 43% | 21,468 mi |
| 2017 | 45 | $93,585 | 26% | 28,221 mi |
Units for sale — listings of each model year in the latest nightly market snapshot.