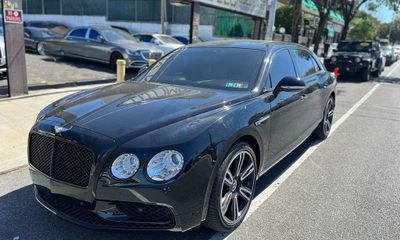
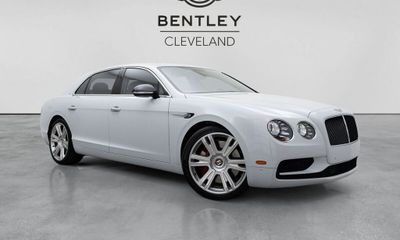
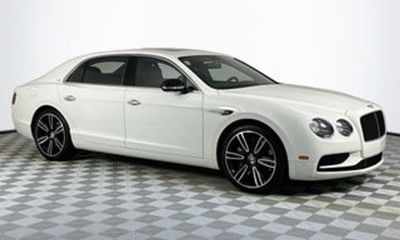
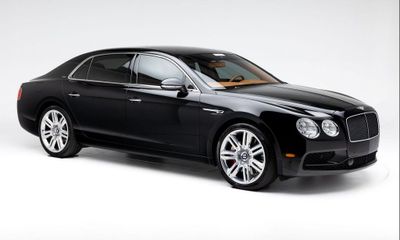
2018 Bentley Flying Spur V8 S
SCBEH9ZAXJC071000
This vehicle is no longer listed. The figures below describe the market for this build.
Market price range
Based on 6 comparable same-build listings · Market data as of September 2, 2026Price history for this VIN
Asking price over time
Asking prices recorded across 4 listing dates for VIN SCBEH9ZAXJC071000, spanning 3 years 2 months.
Listings
Full listing history on VehiSales →No active listings of this exact VIN right now.
Former listings
| Dealer | Location | Price | Mileage | Listed |
|---|---|---|---|---|
| Rolls-Royce Motor Cars Raleigh | Raleigh, NC 27604 | $89,315 | 14,719 mi | 2025-07-17 |
| — | $99,488 | 14,718 mi | 2024-12-10 | |
| Mercedes Benz of Barrington | Barrington, IL 60010 | $106,450 | 11,510 mi | 2023-04-13 |
| Perillo Downers Grove | Downers Grove, IL 60515 | $165,866 | 9,417 mi | 2022-05-28 |
Estimate the monthly payment at the typical market price ($78,689)
This vehicle is no longer listed, so the estimate starts from $78,689 — the typical market price for this build. Move the numbers to match your own loan.
Estimate only. Excludes tax, title, registration and dealer fees, and assumes a fixed-rate loan with equal monthly payments. Your actual rate depends on your credit and lender.
Decoded from the VIN
NHTSA build data for SCBEH9ZAXJC071000Full factory specs for this build →
- ✓ Backup camera
- ✗ Blind-spot monitor
- ✗ Lane departure
- ✓ ABS
- ✓ Electronic stability
Fuel economy (EPA)
Assumes 15,000 miles a year at $3.10/gallon and 16 MPG combined.
5-year cost to own
Beyond the sticker: what this 2018 Bentley Flying Spur likely costs over five years at 15,000 mi/yr.
Estimate — insurance and taxes vary by driver and state.
Model-level data for the 2018 Bentley Flying Spur from EPA fueleconomy.gov, refreshed August 28, 2026.
Where the price is heading
Typical asking price for a 2018 Bentley Flying Spur over the last 6 months — the market softened $4,361 in that span.
Monthly price table
| Month | Typical price |
|---|---|
| December 2025 | $77,946 |
| January 2026 | $76,119 |
| February 2026 | $76,623 |
| June 2026 | $71,039 |
| July 2026 | $73,981 |
| August 2026 | $73,585 |
How it compares to rivals
Median asking price for comparable body styles listed near this car| Model | Median price | For sale nearby | vs this car |
|---|---|---|---|
| 2018 Bentley Flying Spur V8 S (this car) | $78,689 | 6 | — |
| 2016 Dodge Charger | $12,350 | 38 | −$66,339 |
| 2020 Honda Accord | $16,786 | 30 | −$61,903 |
| 2019 Toyota Camry | $18,998 | 24 | −$59,691 |
| 2020 Honda Civic | $15,474 | 22 | −$63,215 |
| 2020 Toyota Corolla | $16,150 | 20 | −$62,539 |
Cheapest active listings of each comparable body style in this region — median of what those models actually ask.
Market by model year
Gen 1 · 2014–presentWhat each model year costs right now — live supply, median asking price and how much value each year keeps versus the newest one.
| Year | Units for sale | Median price | vs newest | Avg mileage |
|---|---|---|---|---|
| 2026 | 93 | $314,140 | 100% | — |
| 2025 | 27 | $285,900 | 91% | 2,237 mi |
| 2024 | 27 | $219,995 | 70% | 6,472 mi |
| 2023 | 20 | $178,490 | 57% | 16,682 mi |
| 2022 | 34 | $160,200 | 51% | 20,485 mi |
| 2021 | 27 | $137,777 | 44% | 25,867 mi |
| 2020 | 13 | $146,995 | 47% | 27,772 mi |
| 2018 | 18 | $75,785 | 24% | 35,515 mi |
Units for sale — listings of each model year in the latest nightly market snapshot.