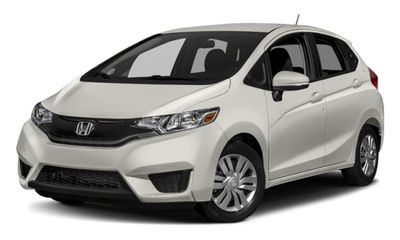
2017 Honda FIT EX
JHMGK5H96HS015657
This vehicle is no longer listed. The figures below describe the market for this build.
Market price range
Based on 5 comparable same-build listings · Market data as of September 2, 2026Listings
Full listing history on VehiSales →No active listings of this exact VIN right now.
Estimate the monthly payment at the typical market price ($15,495)
This vehicle is no longer listed, so the estimate starts from $15,495 — the typical market price for this build. Move the numbers to match your own loan.
Estimate only. Excludes tax, title, registration and dealer fees, and assumes a fixed-rate loan with equal monthly payments. Your actual rate depends on your credit and lender.
Decoded from the VIN
NHTSA build data for JHMGK5H96HS015657Full factory specs for this build →
- ✓ Backup camera
- ✓ Blind-spot monitor
- ✗ Lane departure
- ✓ ABS
- ✓ Electronic stability
Fuel economy (EPA)
Assumes 15,000 miles a year at $3.10/gallon and 34 MPG combined.
5-year cost to own
Beyond the sticker: what this 2017 Honda FIT likely costs over five years at 15,000 mi/yr.
Estimate — insurance and taxes vary by driver and state.
Safety & recalls
NHTSA crash tests & recall campaigns for this model yearTested configuration: 2017 Honda Fit 5 HB FWD
Model-level data for the 2017 Honda FIT from NHTSA (recalls, NCAP crash tests) and EPA fueleconomy.gov, refreshed August 27, 2026.
Where the price is heading
Typical asking price for a 2017 Honda FIT over the last 6 months — the market firmed $1,190 in that span.
Monthly price table
| Month | Typical price |
|---|---|
| April 2026 | $13,900 |
| May 2026 | $14,000 |
| June 2026 | $14,998 |
| July 2026 | $14,788 |
| August 2026 | $14,872 |
| September 2026 | $15,090 |
Market by model year
Gen 3 · 2015–2020What each model year costs right now — live supply, median asking price and how much value each year keeps versus the newest one.
| Year | Units for sale | Median price | vs newest | Avg mileage |
|---|---|---|---|---|
| 2020 | 124 | $18,124 | 100% | 61,132 mi |
| 2019 | 205 | $16,700 | 92% | 68,149 mi |
| 2018 | 157 | $15,084 | 83% | 86,566 mi |
| 2017 | 118 | $13,964 | 77% | 87,531 mi |
| 2016 | 285 | $12,587 | 69% | 95,998 mi |
| 2015 | 418 | $11,500 | 63% | 107,659 mi |
Units for sale — listings of each model year in the latest nightly market snapshot.