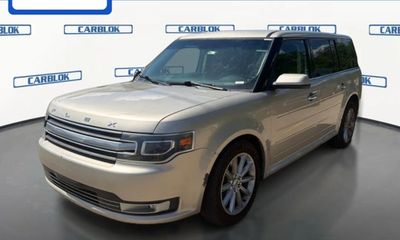
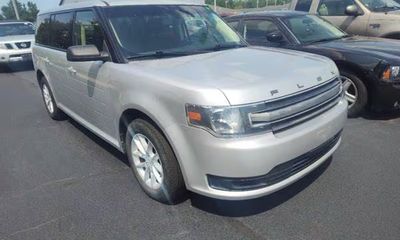
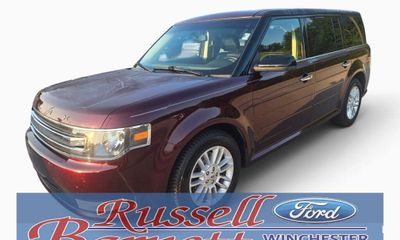
2018 Ford Flex SEL
2FMGK5C89JBA00744
This vehicle is no longer listed. The figures below describe the market for this build.

Market price range
Based on 57 comparable same-build listings · Market data as of August 31, 2026Price history for this VIN
Asking price over time
Asking prices recorded across 2 listing dates for VIN 2FMGK5C89JBA00744, spanning 4 years 3 months.
Listings
Full listing history on VehiSales →No active listings of this exact VIN right now.
Former listings
| Dealer | Location | Price | Mileage | Listed |
|---|---|---|---|---|
| Gene Messer Ford Lincoln of Lubbock | Lubbock, TX 79407 | $14,334 | 64,077 mi | 2025-06-07 |
| Gene Messer Ford of Lubbock | Lubbock, TX 79416 | $14,334 | 64,076 mi | 2025-06-07 |
Estimate the monthly payment at the typical market price ($12,995)
This vehicle is no longer listed, so the estimate starts from $12,995 — the typical market price for this build. Move the numbers to match your own loan.
Estimate only. Excludes tax, title, registration and dealer fees, and assumes a fixed-rate loan with equal monthly payments. Your actual rate depends on your credit and lender.
Decoded from the VIN
NHTSA build data for 2FMGK5C89JBA00744- ✓ Backup camera
- ✓ Blind-spot monitor
- ✗ Lane departure
- ✓ ABS
- ✓ Electronic stability
Rebuild the original window sticker for this VIN — packages, standard equipment and the sticker price the seller left out of the ad.
Get the original window sticker for this VIN →Fuel economy (EPA)
Assumes 15,000 miles a year at $3.10/gallon and 18 MPG combined.
5-year cost to own
Beyond the sticker: what this 2018 Ford Flex likely costs over five years at 15,000 mi/yr.
Estimate — insurance and taxes vary by driver and state.
Safety & recalls
NHTSA crash tests & recall campaigns for this model yearThe 2018 Ford Flex has 3 recall campaigns as of August 2026. NHTSA rated it 4 out of 5 stars for rollover. EPA combined fuel economy: 18 MPG.
Tested configuration: 2018 Ford Flex SUV AWD
-
SUSPENSIONFord Motor Company (Ford) is recalling certain 2013-2018 Lincoln MKT and Ford Flex and Taurus vehicles with the Police Interceptor or SHO Performance Pack.NHTSA campaign 20V072000
-
BACK OVER PREVENTIONFord Motor Company (Ford) is recalling certain 2015-2019 Flex, 2015 Explorer, Lincoln MKT, Lincoln MKZ, 2015-2016 C-Max, Escape, Taurus, 2016 Fusion, 2018-2019 Taurus, 2019…NHTSA campaign 25V695000
-
STRUCTUREFord Motor Company (Ford) is recalling certain 2017-2019 Flex vehicles. The driver and front passenger B-Pillar door trim may detach while driving.NHTSA campaign 25V732000
Recall campaigns apply to the model year, not to one car. Check remedy status for this VIN at nhtsa.gov/recalls.
Model-level data for the 2018 Ford Flex from NHTSA (recalls, NCAP crash tests) and EPA fueleconomy.gov, refreshed August 27, 2026.
Where the price is heading
Typical asking price for a 2018 Ford Flex over the last 6 months — the market softened $549 in that span.
Monthly price table
| Month | Typical price |
|---|---|
| March 2026 | $13,995 |
| April 2026 | $13,299 |
| May 2026 | $13,825 |
| June 2026 | $13,742 |
| July 2026 | $13,495 |
| August 2026 | $13,446 |
How it compares to rivals
Median asking price for comparable body styles listed near this car| Model | Median price | For sale nearby | vs this car |
|---|---|---|---|
| 2018 Ford Flex SEL (this car) | $12,995 | 57 | — |
| 2017 Chevrolet Tahoe | $23,593 | 14 | +$10,598 |
| 2020 Jeep Wrangler | $23,014 | 10 | +$10,019 |
| 2018 Jeep Compass | $10,995 | 9 | −$2,000 |
| 2018 Chevrolet Equinox | $15,895 | 9 | +$2,900 |
| 2019 Jeep Grand Cherokee | $17,770 | 9 | +$4,775 |
Cheapest active listings of each comparable body style in this region — median of what those models actually ask.
Market by model year
Gen 1 · 2009–2019What each model year costs right now — live supply, median asking price and how much value each year keeps versus the newest one.
| Year | Units for sale | Median price | vs newest | Avg mileage |
|---|---|---|---|---|
| 2019 | 436 | $15,770 | 100% | 96,943 mi |
| 2018 | 162 | $13,394 | 85% | 110,687 mi |
| 2017 | 110 | $11,995 | 76% | 115,118 mi |
| 2016 | 158 | $9,996 | 63% | 126,529 mi |
| 2015 | 110 | $9,028 | 57% | 127,474 mi |
| 2014 | 210 | $8,492 | 54% | 135,192 mi |
| 2013 | 127 | $7,995 | 51% | 146,710 mi |
| 2012 | 67 | $6,995 | 44% | 153,852 mi |
Units for sale — listings of each model year in the latest nightly market snapshot.