$3,149 higher median
2013 GMC Acadia
All trims
$7,898Median asking price · 184 qualifying listings
Middle 50%$5,995–$9,995
Find listings on VehiSales ↗Actual SLE 1 listing photo; individual equipment may differ.
For car buyers & owners
Start with the car's VIN
Or choose what you need
VehiLeaks and VehiSales are our sister sites for shoppers. Links marked “On … ↗” open in a new tab.
Car prices & market trends
What do cars really cost?
Latest reading
Reports built from live dealer listings.
Monthly market report How asking prices moved this monthFor developers & data teams
Vehicle data — listings, auctions, titles and images
Delivered to your cloud as files, through an API, or straight to your AI assistant.
# one row per listing
vin, year, make, model,
trim, price, mileage,
dealer, zip, photos
Developer API
Market comps for a year, make, model and ZIP.
# market summary + comps
GET /api/v1/market/
  comps?make=Toyota
# → 200 OK
{ "summary", "listings", … }
AI assistant (MCP)
Ask Claude or ChatGPT about real listings.
1FM5K8B84DGC32613
GREAT DEAL
· $3,767 below typical price
Springfield, MA
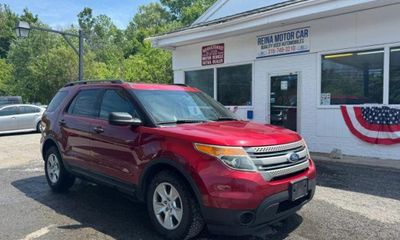
This 2013 Ford Explorer Base is listed at $4,749 with 178,410 miles in Springfield, MA.
Compare alternatives from other brands ↓
Contact details come from the dealer's listing and public business records. VinAssessment is not the seller and takes no fee — you deal with the dealer directly.
2013 Ford Explorer Base
VIN 1FM5K8B84DGC32613

This vehicle: $4,749 — below the market range (typical price $8,516)
Asking $4,749 · typical market price $8,516 · based on 41 comparable same-build listings.
2013 Ford Explorer Base for sale near SpringfieldMA
This car is the cheapest of 26 within 50 miles
Compare on VehiSales ↗ · No dealer spam.
We don't sell cars and never share your details with dealers.
50 miles around Springfield
Lower price Other cars Search center

Dots show approximate vehicle locations.
Vehicle locations appear when available.
Price dropped $1 (−0.0%) over 70 days.
Asking prices recorded across 3 listing dates for VIN 1FM5K8B84DGC32613, spanning 70 days.
| Dealer | Location | Price | Mileage | Listed | Seen |
|---|---|---|---|---|---|
| AG Auto sales | Springfield, MA 1151 | $4,749 | 178,410 mi | 2026-11-03 | 22 h ago |
| AG Auto Sales | Indian Orchard, MA 1151 | $4,749 | 178,410 mi | 2026-10-28 | 3 d ago |
| AG Auto Group LLC | Indian Orchard, MA 1151 | $4,749 | 178,410 mi | 2026-05-15 | 1 d ago |
| Dealer | Location | Price | Mileage | Listed | Seen |
|---|---|---|---|---|---|
| carzing | Indian Orchard, Massachusetts 1151 | $4,250 | 178,410 mi | 2026-10-11 | 18 d ago |
| — | West springfield, MA 1089 | $4,400 | 178,100 mi | 2026-10-04 | 30 d ago |
| Ag Auto Sales | 1151 | $4,749 | 178,410 mi | 2026-09-01 | 3 d ago |
| Ag Auto Sales | Springfield, MA 1151 | $4,250 | 178,410 mi | 2026-09-01 | 14 d ago |
| AG Auto Sales | Indian Orchard, MA 1151 | $4,250 | 178,410 mi | 2026-08-14 | 4 d ago |
| AG Auto Group LLC | Indian Orchard, MA 1151 | $4,250 | 178,410 mi | 2026-05-16 | 15 d ago |
Full factory specs for this build →
Assumes 15,000 miles a year at $3.10/gallon and 18 MPG combined.
Beyond the sticker: what this 2013 Ford Explorer likely costs over five years at 15,000 mi/yr.
Estimate — insurance and taxes vary by driver and state.
The 2013 Ford Explorer has 12 recall campaigns as of October 2026. NHTSA rated it 5 out of 5 stars overall. EPA combined fuel economy: 18 MPG.
Tested configuration: 2013 Ford Explorer 4 DR SUV AWD
Recall campaigns apply to the model year, not to one car. Check remedy status for this VIN at nhtsa.gov/recalls.
Model-level data for the 2013 Ford Explorer from NHTSA (recalls, NCAP crash tests) and EPA fueleconomy.gov, refreshed October 26, 2026.
Typical asking price for a 2013 Ford Explorer over the last 6 months — the market softened $87 in that span.
| Month | Typical price |
|---|---|
| June 2026 | $8,495 |
| July 2026 | $8,222 |
| August 2026 | $8,332 |
| September 2026 | $8,258 |
| October 2026 | $8,000 |
| November 2026 | $8,408 |
Compare 2013 Ford Explorer with other models from the same year. Choose the trims that matter to you.
As of November 11, 2026, among same-year alternatives to the 2013 Ford Explorer in this catalog, the 2013 Nissan Pathfinder has the lowest median asking price ($6,900, 221 listings with photos) and the 2013 Hyundai Santa FE the highest ($7,900, 64 listings).
Comparison catalog · Snapshot November 11, 2026, 05:00 UTC · Only listings with photos. This sample is separate from the price overview above and its figures differ.

Base · United States
$4,749Catalog asking price for this VIN
Trim median $7,749 · 85 listings with photos
Middle 50%: $6,100–$9,999
Explore this model’s prices →Photo: Base · 178,410 mi · view VIN
All trims
$7,898Median asking price · 184 qualifying listings
Middle 50%$5,995–$9,995
Find listings on VehiSales ↗Actual SLE 1 listing photo; individual equipment may differ.

All trims
$7,408Median asking price · 270 qualifying listings
Middle 50%$5,950–$9,177
Find listings on VehiSales ↗Actual Denali listing photo; individual equipment may differ.

All trims
$7,500Median asking price · 125 qualifying listings
Middle 50%$5,980–$8,995
Find listings on VehiSales ↗Actual Leather listing photo; individual equipment may differ.

All trims
$6,900Median asking price · 221 qualifying listings
Middle 50%$5,800–$8,615
Find listings on VehiSales ↗Actual S listing photo; individual equipment may differ.

All trims
$7,900Median asking price · 64 qualifying listings
Middle 50%$6,550–$9,878
Find listings on VehiSales ↗Actual Top listing photo; individual equipment may differ.
| Model / trim | Median | Middle 50% | Listings |
|---|---|---|---|
| 2013 Ford Explorer Base | $7,749 | $6,100–$9,999 | 85 |
| 2013 GMC Acadia All trims | $7,898 | $5,995–$9,995 | 184 |
| 2013 GMC Terrain All trims | $7,408 | $5,950–$9,177 | 270 |
| 2013 Buick Enclave All trims | $7,500 | $5,980–$8,995 | 125 |
| 2013 Nissan Pathfinder All trims | $6,900 | $5,800–$8,615 | 221 |
| 2013 Hyundai Santa FE All trims | $7,900 | $6,550–$9,878 | 64 |
Only catalog listings with photos are included. Trim names do not verify equivalent equipment. Prices are asking prices, not completed sales. Alternatives share the body style and class of the source model; the nearest model years are used when the same year has too few listings. Price differences are not a valuation adjustment or guaranteed savings.
Snapshot: November 11, 2026, 05:00 UTC. 0 source listings excluded by statistical price screening; this does not verify that every deposit or payment ad has been removed.
VehiSales opens in a new tab with the model, year and known mileage range. Confirm trim, fuel, drivetrain, condition and location on VehiSales; its live inventory may differ.
What each model year costs right now — live supply, median asking price and how much value each year keeps versus the newest one.
| Year | Units for sale | Median price | vs newest | Avg mileage |
|---|---|---|---|---|
| 2019 | 1,463 | $16,979 | 100% | 101,133 mi |
| 2018 | 2,360 | $15,506 | 91% | 103,748 mi |
| 2017 | 2,738 | $13,728 | 81% | 111,440 mi |
| 2016 | 2,188 | $11,990 | 71% | 122,776 mi |
| 2015 | 1,333 | $9,995 | 59% | 131,106 mi |
| 2014 | 1,009 | $8,995 | 53% | 139,806 mi |
| 2013 | 813 | $8,244 | 49% | 145,442 mi |
| 2012 | 233 | $7,979 | 47% | 149,296 mi |
Units for sale — listings of each model year in the latest nightly market snapshot.