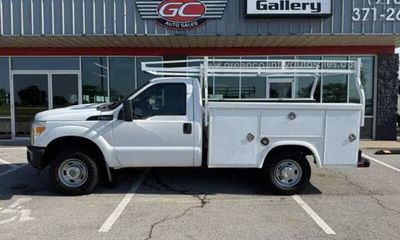
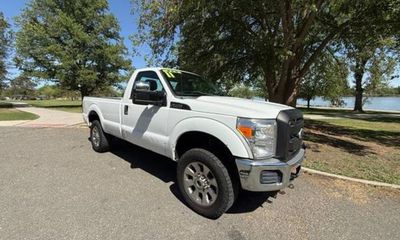
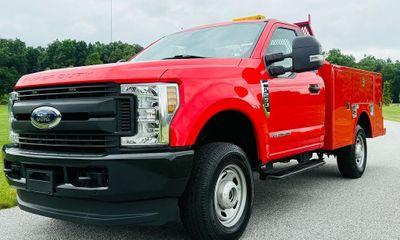
2011 Ford F-250 XL
1FDBF2BT7BEC98025
This vehicle is no longer listed. The figures below describe the market for this build.

Listings
Full listing history on VehiSales →No active listings of this exact VIN right now.
Decoded from the VIN
NHTSA build data for 1FDBF2BT7BEC98025- ✗ Backup camera
- ✗ Blind-spot monitor
- ✗ Lane departure
- ✗ ABS
- ✗ Electronic stability
Safety & recalls
NHTSA crash tests & recall campaigns for this model yearThe 2011 Ford F-250 Super Duty has 2 recall campaigns as of August 2026. NHTSA rated it 3 out of 5 stars for rollover.
Tested configuration: 2011 Ford F-250 Super Crew PU/CC 4x4
-
ELECTRICAL SYSTEMFORD IS RECALLING CERTAIN MODEL YEAR 2011 FORD F-150, F-250, F-350, F-450, F-550, EDGE, AND LINCOLN MKX TRUCKS MANUFACTURED FROM OCTOBER 25, 2010, THROUGH NOVEMBER 20, 2010.NHTSA campaign 11V128000
-
STRUCTUREFORD IS RECALLING CERTAIN MODEL YEAR 2011 F-150, F-250, F-350, F-450, F-550, EDGE AND LINCOLN MKX VEHICLES.NHTSA campaign 10V659000
Recall campaigns apply to the model year, not to one car. Check remedy status for this VIN at nhtsa.gov/recalls.
Model-level data for the 2011 Ford F-250 Super Duty from NHTSA (recalls, NCAP crash tests) and EPA fueleconomy.gov, refreshed August 28, 2026.
Where the price is heading
Typical asking price for a Ford F-250 over the last 6 months — the market firmed $892 in that span.
Monthly price table
| Month | Typical price |
|---|---|
| April 2026 | $19,495 |
| May 2026 | $19,995 |
| June 2026 | $17,995 |
| July 2026 | $18,640 |
| August 2026 | $19,851 |
| September 2026 | $20,387 |
How it compares to rivals
Median asking price for comparable body styles listed near this car| Model | Median price | For sale nearby | vs this car |
|---|---|---|---|
| 2011 Ford F-250 XL (this car) | — | 0 | — |
| 2009 Ford F-150 | $10,489 | 7 | — |
| 2010 Toyota Tundra | $14,995 | 6 | — |
| 2012 Ford F-350 | $25,380 | 5 | — |
| 2011 Ford Ranger | $15,802 | 2 | — |
| 2013 Ram 1500 | $15,888 | 2 | — |
Cheapest active listings of each comparable body style in this region — median of what those models actually ask.
Market by model year
What each model year costs right now — live supply, median asking price and how much value each year keeps versus the newest one.
| Year | Units for sale | Median price | vs newest | Avg mileage |
|---|---|---|---|---|
| 2027 | 1,049 | $74,385 | 100% | — |
| 2026 | 91 | $77,605 | 104% | 1,245 mi |
| 2022 | 65 | $39,950 | 54% | 53,331 mi |
| 2021 | 46 | $32,172 | 43% | 83,197 mi |
| 2020 | 30 | $31,556 | 42% | 83,716 mi |
| 2019 | 111 | $29,980 | 40% | 88,901 mi |
| 2018 | 68 | $22,094 | 30% | 98,814 mi |
| 2017 | 16 | $30,745 | 41% | 120,966 mi |
Units for sale — listings of each model year in the latest nightly market snapshot.