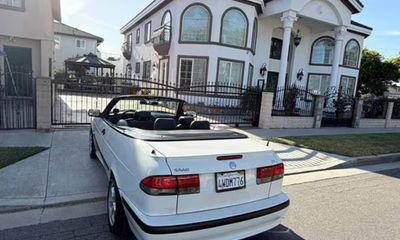
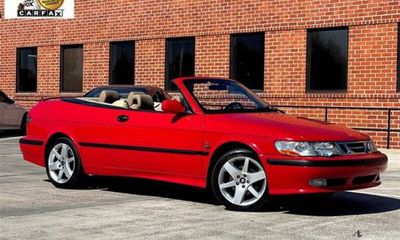
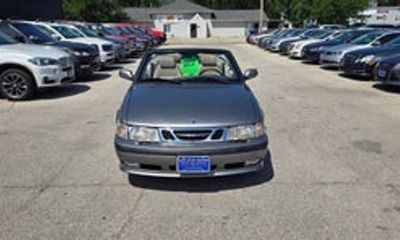
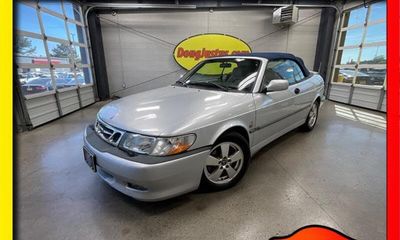
2000 Saab 9-3 SE Spring Edition
YS3DF78K4Y7009827
This vehicle is no longer listed. The figures below describe the market for this build.
Market price range
Based on 4 comparable same-build listings — a small sample, treat the band as a rough guide · Market data as of September 16, 2026Love this car? See what else is out there.
2000 Saab 9-3 SE Spring Edition for sale near you
Compare prices on similar cars within 50 miles of you.
Compare on VehiSales ↗ · No dealer spam.
We don't sell cars and never share your details with dealers.
50 miles around you
Lower price Other cars Search center
Dots show approximate vehicle locations.
Vehicle locations appear when available.
Listings
Full listing history on VehiSales →No active listings of this exact VIN right now.
Decoded from the VIN
NHTSA build data for YS3DF78K4Y7009827Full factory specs for this build →
- ✗ Backup camera
- ✗ Blind-spot monitor
- ✗ Lane departure
- ✗ ABS
- ✗ Electronic stability
Fuel economy (EPA)
Assumes 15,000 miles a year at $3.10/gallon and 20 MPG combined.
5-year cost to own
Beyond the sticker: what this 2000 Saab 9-3 likely costs over five years at 15,000 mi/yr.
Estimate — insurance and taxes vary by driver and state.
Safety & recalls
NHTSA crash tests & recall campaigns for this model yearThe 2000 Saab 9-3 has 2 recall campaigns as of September 2026. EPA combined fuel economy: 20 MPG.
-
ELECTRICAL SYSTEMCERTAIN PASSENGER VEHICLES EQUIPPED WITH B205/B235 4-CYLINDER GASOLINE ENGINES AND B308 6-CYLINDER GASOLINE ENGINES MAY EXPERIENCE OVERHEATING AND BURNOUT OF THE ISOLATED GATED…NHTSA campaign 05V399000
-
AIR BAGSVEHICLE DESCRIPTION: CERTAIN PASSENGER VEHICLES FAIL TO COMPLY WITH REQUIREMENTS OF FMVSS NO.NHTSA campaign 01V168000
Recall campaigns apply to the model year, not to one car. Check remedy status for this VIN at nhtsa.gov/recalls.
Model-level data for the 2000 Saab 9-3 from NHTSA (recalls, NCAP crash tests) and EPA fueleconomy.gov, refreshed September 2, 2026.
Market by model year
What each model year costs right now — live supply, median asking price and how much value each year keeps versus the newest one.
| Year | Units for sale | Median price | vs newest | Avg mileage |
|---|---|---|---|---|
| 2011 | 10 | $8,348 | 100% | 113,780 mi |
| 2008 | 28 | $6,197 | 74% | 121,715 mi |
| 2007 | 22 | $5,997 | 72% | 131,734 mi |
| 2006 | 25 | $5,995 | 72% | 119,916 mi |
| 2005 | 18 | $5,341 | 64% | 116,413 mi |
| 2004 | 22 | $4,597 | 55% | 119,544 mi |
Units for sale — listings of each model year in the latest nightly market snapshot.