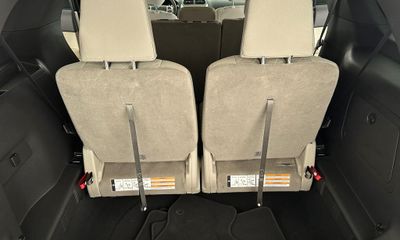
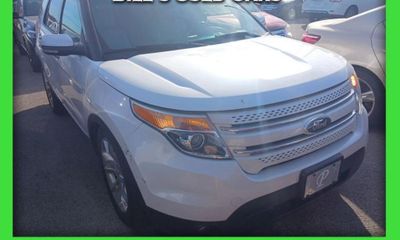
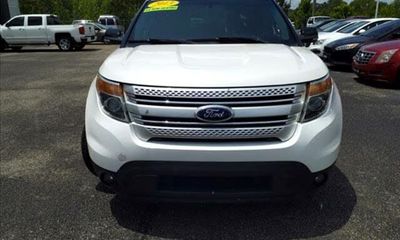
2013 Ford Explorer
00M5K8B88DGC83306
This vehicle is no longer listed. The figures below describe the market for this build.
Love this car? See what else is out there.
2013 Ford Explorer for sale near you
Compare prices on similar cars within 50 miles of you.
Compare on VehiSales ↗ · No dealer spam.
We don't sell cars and never share your details with dealers.
50 miles around you
Lower price Other cars Search center
Dots show approximate vehicle locations.
Vehicle locations appear when available.
Listings
Full listing history on VehiSales →No active listings of this exact VIN right now.
Decoded from the VIN
NHTSA build data for 00M5K8B88DGC83306- ✗ Backup camera
- ✗ Blind-spot monitor
- ✗ Lane departure
- ✗ ABS
- ✗ Electronic stability
Fuel economy (EPA)
Assumes 15,000 miles a year at $3.10/gallon and 18 MPG combined.
Safety & recalls
NHTSA crash tests & recall campaigns for this model yearThe 2013 Ford Explorer has 12 recall campaigns as of August 2026. NHTSA rated it 5 out of 5 stars overall. EPA combined fuel economy: 18 MPG.
Tested configuration: 2013 Ford Explorer 4 DR SUV AWD
-
SUSPENSIONFord Motor Company (Ford) is recalling certain 2011-2017 Explorer vehicles. The rear suspension toe links may fracture due to stress on the rear suspension.NHTSA campaign 19V435000
-
WHEELSFord Motor Company (Ford) is recalling certain Wheel Hub Bearing assemblies, part number HB5Z-1104-C, incorrectly listed as being for installation on the rear axles of 2011-2017…NHTSA campaign 17E048000
-
STRUCTUREFord Motor Company (Ford) is recalling certain model year 2011-2013 Explorer vehicles.NHTSA campaign 15V171000
Recall campaigns apply to the model year, not to one car. Check remedy status for this VIN at nhtsa.gov/recalls.
Model-level data for the 2013 Ford Explorer from NHTSA (recalls, NCAP crash tests) and EPA fueleconomy.gov, refreshed August 27, 2026.
Where the price is heading
Typical asking price for a Ford Explorer over the last 6 months — the market softened $48 in that span.
Monthly price table
| Month | Typical price |
|---|---|
| April 2026 | $8,798 |
| May 2026 | $8,799 |
| June 2026 | $8,495 |
| July 2026 | $8,381 |
| August 2026 | $8,495 |
| September 2026 | $8,750 |
Market by model year
Gen 3 · 2011–2019What each model year costs right now — live supply, median asking price and how much value each year keeps versus the newest one.
| Year | Units for sale | Median price | vs newest | Avg mileage |
|---|---|---|---|---|
| 2019 | 1,224 | $17,696 | 100% | 98,512 mi |
| 2018 | 1,895 | $15,998 | 90% | 103,686 mi |
| 2017 | 2,060 | $13,995 | 79% | 112,879 mi |
| 2016 | 2,033 | $12,198 | 69% | 122,817 mi |
| 2015 | 1,092 | $10,495 | 59% | 130,829 mi |
| 2014 | 933 | $9,650 | 55% | 136,810 mi |
| 2013 | 759 | $8,495 | 48% | 148,251 mi |
| 2012 | 235 | $7,985 | 45% | 152,162 mi |
Units for sale — listings of each model year in the latest nightly market snapshot.